
The cPanel Resource Usage page not only shows the current load but also indicates how many times the hosting account has reached the resource limits associated with its plan. CloudLinux refers to these instances of exceeding the limits as ‘faults’, or ‘error counts’.
You can access this page in the cPanel Metrics section by clicking on the Resource Usage icon. On the older interface, it is labelled ‘CPU and concurrent connection usage’. For a quick overview of the current values, see the article on monitoring LVE resource usage in real time.
Sections of the site
The page has four tabs:
- Dashboard: the Account total box shows whether the system has limited the account in the past 24 hours and, if so, because of which resource; the DETAILS button takes you to the details. If there were no problems, the box is green and shows the message “Your site had no issues in the past 24 hours”.
- Current usage: the current values, the charts and the table by interval. You can choose the period with the Timeframe button (for example Today) and the resolution with the Time Unit button (for example Hour).
- Snapshot: snapshots taken at the time the limit was reached.
- Options: email notification when the limits are reached (Notify me when I hit my resource limits). On our servers, this cannot be turned on from the account; next to the switch you see the message “You cannot manage this option”.
The Current usage tab
The table at the top of the tab shows the current state for each resource (SPEED Usage, I/O Usage, IOPS, NPROC, Entry Processes, Physical Memory Usage):
| Column | Meaning |
|---|---|
| Description | Resource name |
| Usage | current usage |
| Limit | the limit that comes with your plan; 0 means there is no limit on that resource |
| Fault | always shows a dash here: the current measurement does not count faults |
The number of faults refers to the selected period, so it is shown in the charts and in the table by interval below the table. By default, the Interactive charts view is displayed (the Old mode button switches to the previous charts), with three charts:
- CPU: Average usage (green), MySQL (blue) and Limit (red dashed line). Here, 100% means the highest limit in the period shown, and the MySQL usage may already be included in the average usage, so don’t add the two values together.
- Physical memory: the average memory usage and the limit.
- Faults: the number of times a limit was exceeded, per interval; if there were none, “No faults reported” is shown.
In the header of the CPU and Physical memory charts, the Faults: value is the number of faults of that resource in the period, and the View details button opens the chart in a larger size. By hovering over the chart or using the arrow keys, you can also see the exact values of each interval.
The Usage table below lists the resources (SPEED, PMEM, IO, EP, NPROC, IOPS) by interval (From and To columns: the start and end of the interval), each with three values: A is the average usage, L the limit and F the number of faults. If F is not zero in a row, the account reached that limit during that interval.
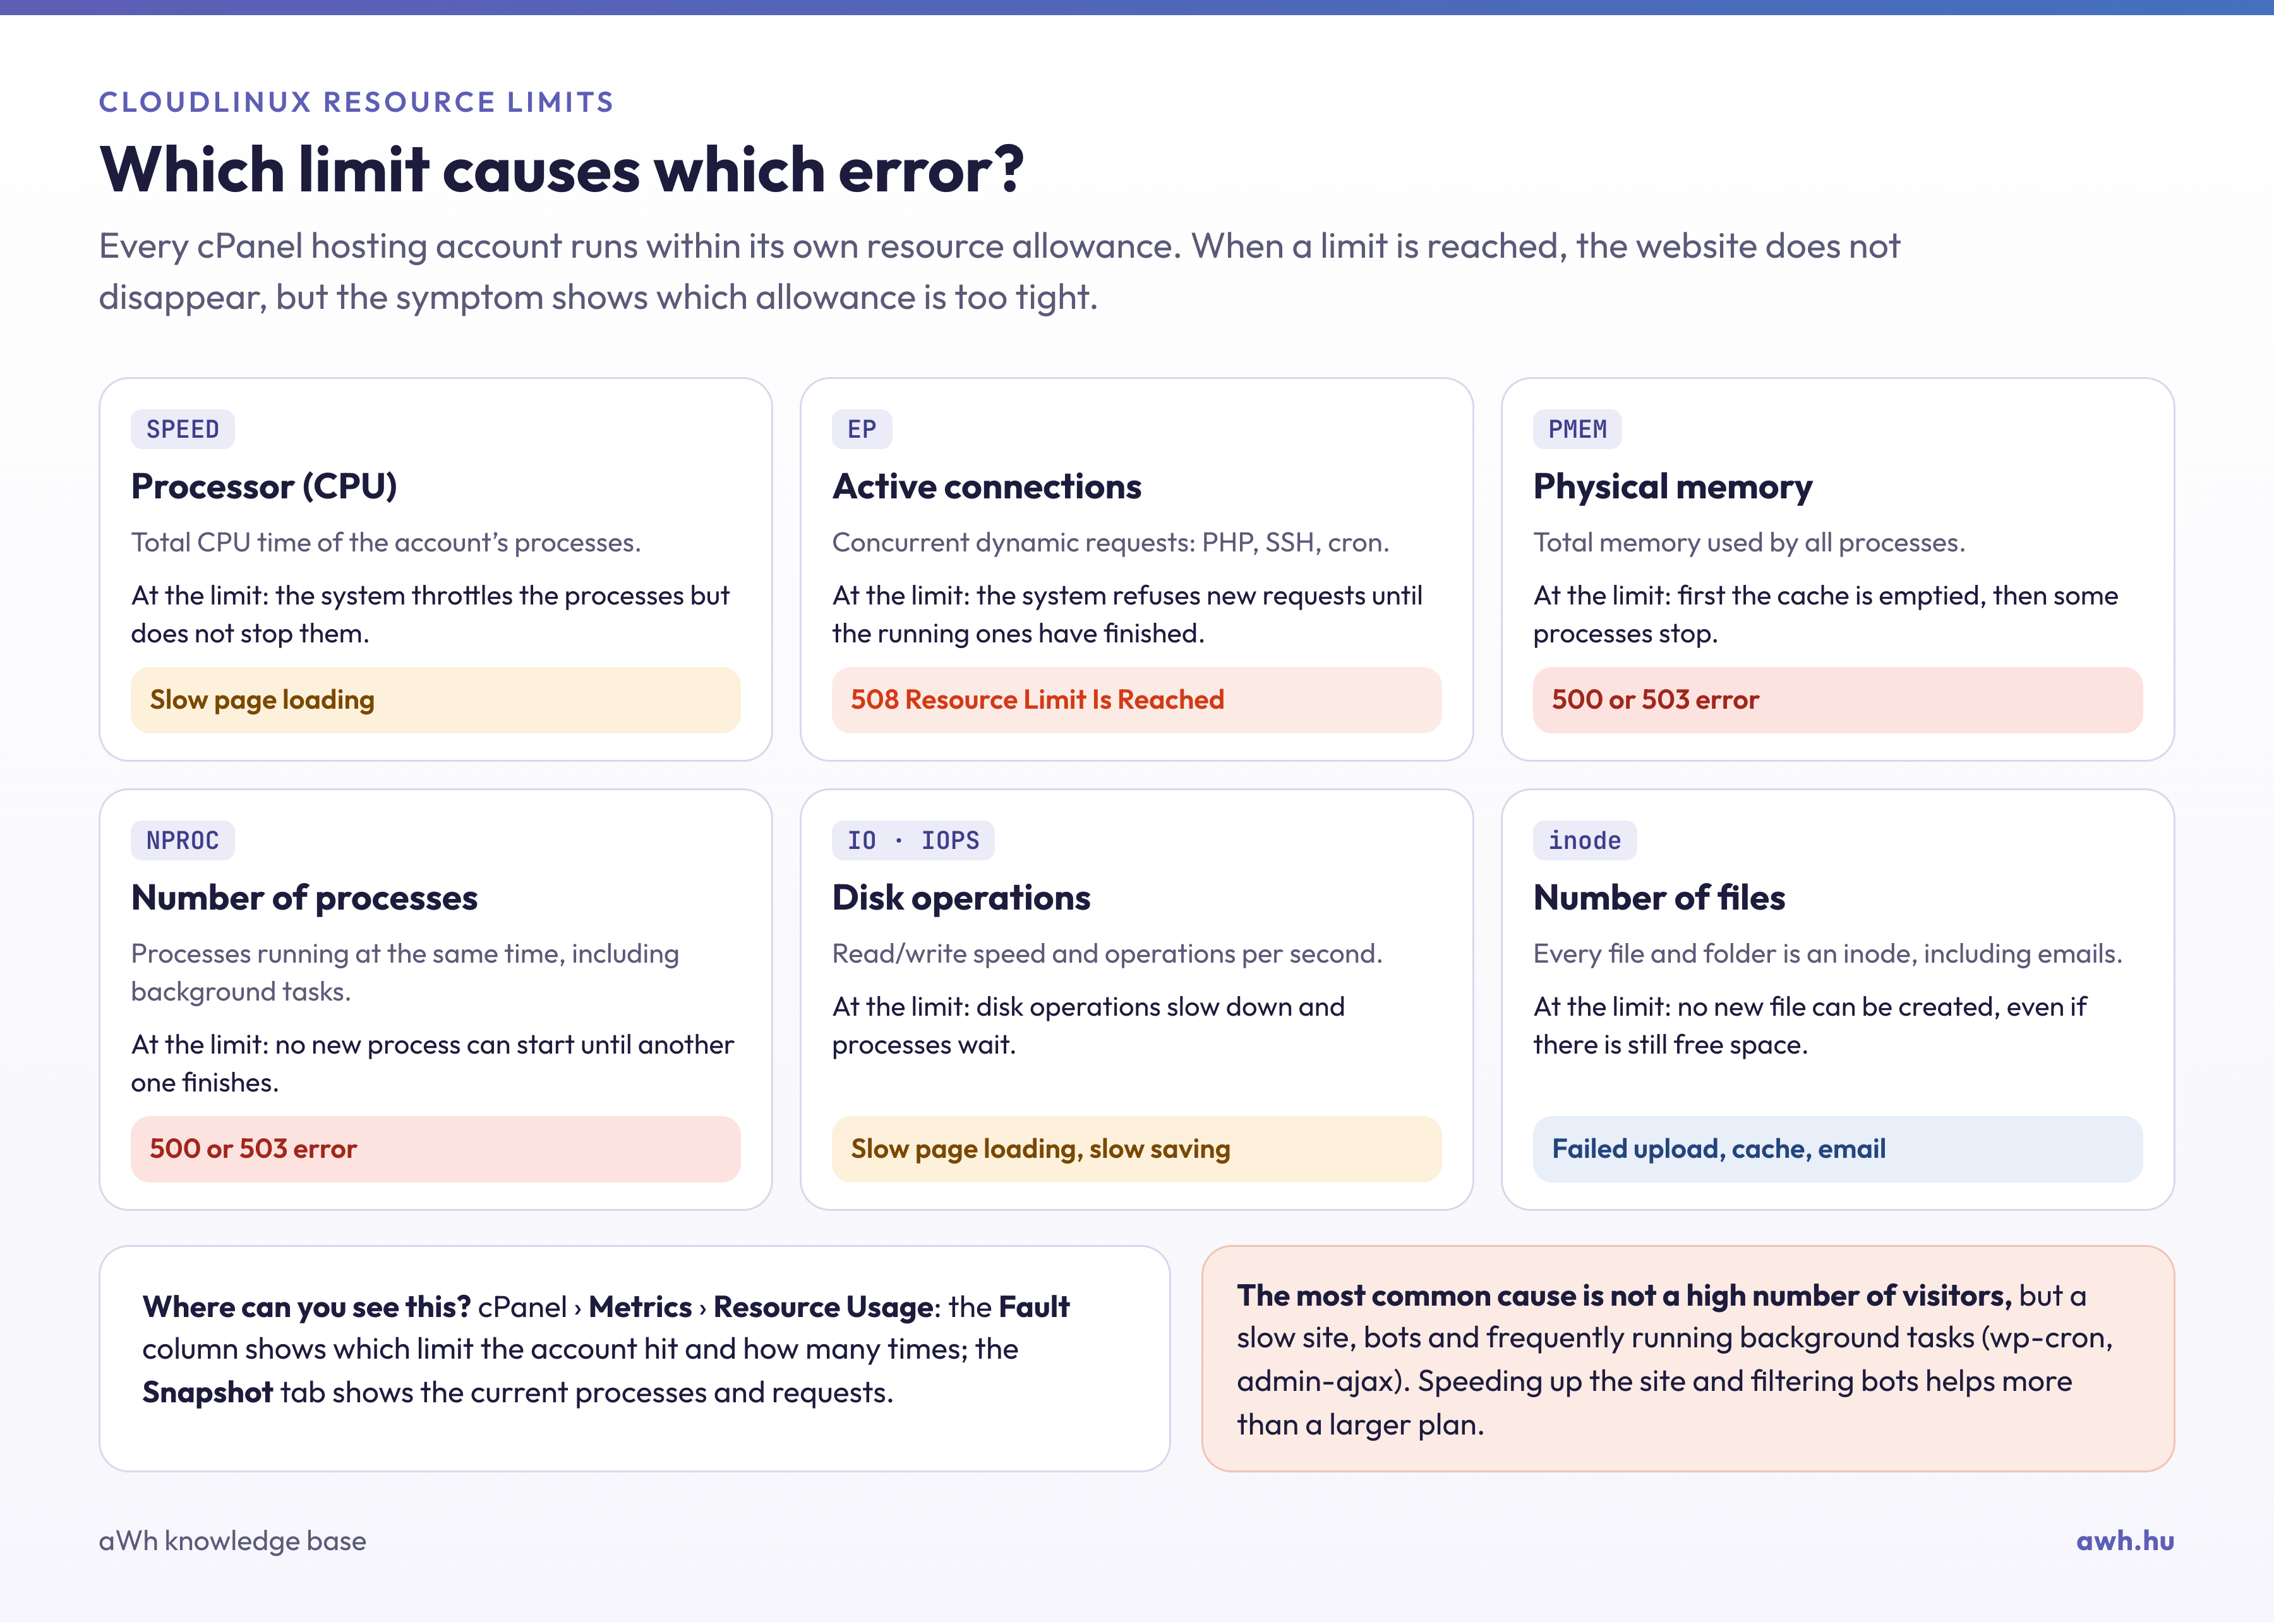
What do the error messages for each resource mean?
| Resources | What happens when the limit is reached? | What does the visitor experience? |
|---|---|---|
| CPU (SPEED) | The system throttles the account’s processes, but does not stop them. | Slower page loading |
| EP (Entry Processes, active connections) | The system rejects any further requests. | Error 508 |
| PMEM (physical memory) | The system first clears the cache; if that is not sufficient, it stops certain processes. | 500 or 503 error |
| NPROC (number of processes) | A new process cannot start until another one has finished. | 500 or 503 error |
| IO and IOPS | Disk operations are slowing down, and processes are being put on hold. | Slower page loading |
When should you be concerned?
A few errors over the course of a month are not a cause for concern: they may be caused by a brief traffic spike or a bot, and the system imposes limits precisely to ensure that the other pages continue to function without disruption. It is worth looking into the matter if:
- Errors occur regularly, either on a daily basis or at a specific time (in which case a cron job is often to blame);
- average usage is consistently close to the limit;
- These errors are EP, PMEM or NPROC errors, as visitors see them as error messages.
The Snapshot tab
When an account reaches a particular limit, CloudLinux takes a snapshot of what was running on the account at that moment. The snapshots consist of three parts:
- Process list: the process ID (PID) of running processes, the command (CMD), and their CPU and memory usage.
- Database Queries: MySQL queries running at the time the snapshot was taken.
- HTTP Queries: URLs served at the time of the snapshot.
The Snapshot tab is the most useful tool for identifying the cause of a problem. If the same URL (for example, wp-cron.php, admin-ajax.php or a search page) or the same script appears repeatedly in the snapshots, that is where optimisation is needed. If long database queries appear in the snapshots, please also read the article on MySQL Governor.
If you are unsure what the data you see means, please contact our support team and we will help you understand it.
